|
downloadable
pdf
UF
engineers are helping to more accurately
predict hurricanes’ destructive forces
by
Aaron Hoover
Hurricane forecasting
has come a long way since the days when killer storms blindsided
coastal residents. Thanks to new research and new technologies,
one day in the not-too-distant future, residents may get advance
warning not only of a hurricane’s projected track but
also its wind speeds when it reaches their street and the
damage it may inflict on their neighborhoods.
New predictive maps will give emergency managers a street-by-street
idea of where to evacuate first, and insurance companies an
advance preview of where to concentrate their adjusters. Days
before the first storm cloud darkens the sky, cities may already
have an estimated damage figure, and maybe even a federal
aid application in the works.
|
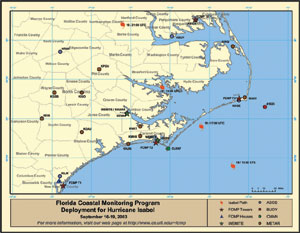
Deployment Map Shows Isabels path to landfall |
The data that
will go into these new maps and models are being assembled
by federal labs, research institutes and universities, including
the University of Florida. In a project as likely to influence
building codes as hurricane damage modeling, UF civil engineers
are working with engineers from Clemson University in South
Carolina to gather the most complete data ever assembled on
ground-level wind speeds — the kind that are most damaging
to buildings. In a separate project, they’re contributing
to a publicly accessible, county-by-county and neighborhood-by-neighborhood
model for hurricane-related insurance losses.
The research can be heavy on number crunching, but the ground-level
wind project is anything but a desk job. To gather the data,
the UF and Clemson engineers haul towers equipped with an
array of monitoring equipment directly into a storm’s
path. The researchers have been chasing hurricanes with these
towers since 1998, but they scored their greatest success
with Hurricane Isabel, which smacked North Carolina Sept.
18, 2003.
With winds of 100 miles per hour, Category 2 Isabel caused
extensive damage along North Carolina’s Outer Banks
before tracking northwest. The storm snarled traffic, shut
down the federal government for two days and left some two
million
people without electricity in North Carolina and Virginia.
Days before the storm neared the United States, civil engineering
doctoral student Forrest Masters had an inkling of what lay
ahead. “I really felt this is a storm we were definitely
going to chase,” he recalls.
|
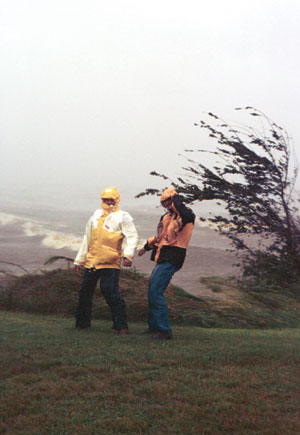
“It
sounds exciting and exotic, but it’s not like the
movie Twister at all — it’s not like we’re
watching cows fly by. There are people who do take risks
in hurricanes, but we’re not in that category”
— Kurt
Gurley |
At
first, Isabel looked like a behemoth, strengthening into a
Category 5 storm, the most powerful in the Saffir-Simpson
scale, in the mid-Atlantic. As it closed in on the United
States mainland, however, it weakened, slowed and jogged toward
North Carolina or points north.
Masters, 26, who has worked on the project since his undergraduate
days and is a veteran of eight previous deployments, sprang
into action. He and another graduate student, Luis Aponte,
and six undergraduates loaded up the team’s van and
two trucks with water, food and equipment and hitched up the
trailers holding the two wind towers.
Together with Kurt Gurley, associate professor of civil engineering
and head of the project, the team left Gainesville for North
Carolina late Monday afternoon, Sept. 15. A similar team,
headed by Clemson civil engineering Professor Tim Reinhold,
and also towing two trailers, departed Clemson about the same
time.
Over the next 36 hours, the team scouted several locations
for the towers, settling on a site in Wilmington and a state
park in Atlantic Beach. The Clemson team deployed its towers
at Frisco, near Cape Hatteras on the Outer Banks, and Elizabeth
City, farther inland. They also installed measurement instruments
on a Wilmington home.
Practice made the job of erecting the towers routine. Trained
crews unfolded each tower from its trailer and erected it
in fewer than 30 minutes. Once up, the 5,500-pound structures
stand more than 33 feet high and serve as platforms for instruments
measuring wind speed, wind direction, barometric pressure,
humidity and rainfall. The towers are designed to withstand
winds exceeding 200 miles per hour, conditions that would
accompany a severe Category 5 storm.
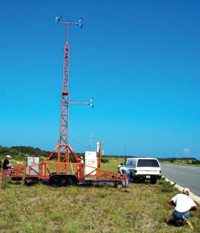
| Practice
made the job of erecting the towers routine. Trained crews
unfolded each tower from its trailer and erected it in
fewer than 30 minutes. Once up, the 5,500-pound structures
stand more than 33 feet high and serve as platforms for
instruments measuring wind speed, wind direction, barometric
pressure, humidity and rainfall. |
 |
When Isabel moved ashore on the Outer Banks early Thurs-day
afternoon, members of the UF and Clemson teams were in motels
in Wilmington. Masters and several members of the Clemson
team were bunkered at a U.S. Coast Guard station in New Elizabeth
north of the eye landfall.
Everyone was well out of harm’s way — a priority
of the project, Gurley says.
“It sounds exciting and exotic, but it’s not like
the movie Twister at all — it’s not like we’re
watching cows fly by,” Gurley says. “There are
people who do take risks in hurricanes, but we’re not
in that category.”
Although the researchers were safely hunkered down, they had
a bird’s eye view of the storm thanks to a new real-time
reporting system Masters developed that worked better than
anyone anticipated.
Hurricane trackers rely primarily on data collected from devices
dropped from airplanes called dropsondes, as well
as onshore and offshore weather monitoring stations, radar
and other systems. But the delay between when the data are
gathered from these devices and when they become available
can be substantial. For example, the fastest ground-based
weather monitoring stations upload information once hourly.
When conditions get rough, monitoring stations also sometimes
fail
as a result of damage from debris or power loss.
To overcome the delays and potential breakdowns, Masters linked
the weather-monitoring devices on each tower with
a laptop computer and a cellular phone. Every 15 minutes,
the laptop connected to the Internet through the cell phone
and uploaded “high resolution” data summarizing
wind speeds, wind directions and other measurements.
Safe in their rooms, the UF team surfed to a web site to monitor
the deterioration of conditions as Isabel came ashore. They
were pleased to discover columns of flawless numbers flowing
from the towers. Among other things, the data revealed the
highest wind speed (101 miles per hour) ever recorded by the
team.
Team members weren’t the only impressed viewers. Officials
at the National Oceanographic and Atmospheric Administra-tion,
or NOAA, and the National Hurricane Center also tapped into
the Web site and used the data to create an experimental wind
map. In fact, at one point during the peak of the storm, the
UF towers were the only monitoring stations that remained
functional, said Reinhold, the Clemson professor.
Mark Powell, a Miami-based NOAA atmospheric scientist, says
the UF data made the map, called H*Wind, the most accurate
real-time map ever created of an approaching hurricane’s
wind speeds and forces.
“We’ve never had high-quality information like
this actually during an event,” Powell says “It
was just incredible how well these towers worked.”
The Federal Emergency Management Agency uses information from
the H*Wind map to estimate the types of structural damage
that may result from hurricane wind damage. Thanks to the
data from the towers, NOAA was able to provide timely advance
projections of peak wind velocities in numerous population
centers along Isabel’s path. Since FEMA has an inventory
of the structures along each track, it was able to project
damage with greater accuracy.
But the real-time data is only the first way the information
the towers collected will prove useful.
More than a month after Isabel, the team was still crunching
the hundreds of thousands of pieces of data recorded by the
towers. Because the towers were situated just north and south
of where Isabel’s eye made landfall, the data is proving
quite comprehensive. By filling a longstanding knowledge gap
about hurricane wind speeds and forces near the ground, the
information could highlight weaknesses in current codes aimed
at protecting buildings in hurricanes.
That will be especially true when the information is merged
with similar data from another part of the UF-Clemson project.
The researchers have installed wind pressure sensors on more
than thirty homes, mostly in Florida, that have been retrofitted
to make them more hurricane worthy. The goal is both to determine
the effectiveness of these retrofits and to gather data on
how real hurricanes affect homes. Although researchers have
only collected data on seven houses to date — none of
it from storms that reached hurricane strength — Reinhold
said the findings so far indicate there may be big differences
in hurricane stresses on homes depending upon whether they
are located in suburban, wooded or open settings. These differences
could result in different building codes for different environments.
“We might have multiple sets of wind pressure coefficients,
depending on the setting,” he says.
Twin satellite towers at Wilmington and Nag’s Head,
meanwhile, will provide the first data on the width of hurricane
gusts, a crucial figure when it comes to damage, Gurley says.
“If a typical house is 50 feet long, and if a typical
lateral gust of wind is 10 feet or 20 feet versus 100 feet,
that tells us about how wind would affect the house in terms
of causing damage,” he says.
The result is especially powerful when combined with other
hurricane research. For example, Gurley is working on a separate
effort, sponsored by the Florida Department of Insurance,
to create a publicly available model that predicts hurricane
dollar damage in each of Florida’s 67 counties. Gurley’s
role in the effort, led by Florida International University’s
International Hurricane Research Center, is to correlate wind
speed to building damage, factoring in the type of construction
used on the building. The end result will be a model that
can predict losses, which helps state government officials
better regulate
insurance rates.
“The model will give the risk exposure for insurance
companies A, B and C within the same zip code at three different
values, depending on the types of structures they insure,”
Gurley says.
Once linked, the insurance, wind and other models could have
a powerful impact.
“NOAA could say ‘This is where the storm will
go. This is the intensity; then, we could use the data sets
we’re collecting now to say, ‘Given that info,
this entire coastal region is subject to the following extreme
cases of wind speeds, and given that the majority of homes
along this part of the coast are timber frame or concrete
block, then we can expect the following level of damage to
occur,’” he says.
Kurt Gurley
Associate Professor of Civil Engineering
University of Florida
(352) 392-9537 ext. 1508
kgurl@ce.ufl.edu
Tim Reinhold
Professor of Civil Engineering
Clemson University
(864) 656-5941
rtimoth@clemson.edu
|